
The Workload Report - Introduction
Breaking down all the data into actionable advice

I want to get this post up now as a sort of catch-all evergreen introduction to The Workload Report. Quick refresher if you need the link for the google sheet, I would recommend bookmarking this. Later today, I will be sending out my official Week 1 analysis. If you have started digging in to the sheets, and are wondering what all the numbers mean, this is a good starting point.
One of the main things that I think differentiates The Workload Report from other similar tools in the industry is the comparison to 3 week rolling averages. Since it is only Week 1, these comparisons aren’t yet available, but I will revisit in Week 4 when they come into play.
The Workload Report is broken down into three main categories, and I am very intentional with the order of things.
OPPORTUNITY
First up is opportunity. Over the course of a season, this is arguably the single most important thing to focus on for players. Each NFL season consists of 17 games (which is already an incredibly small sample size), and each game is a small sample size of each season. There is a ton of variance when it comes to fantasy football, but looking at opportunity can help a lot. How do we define opportunity?
Snap and Snap % - A lot of these are going to be pretty straightforward, and snaps is one of them. How many plays was the player on the field for. Snap % just shows how often they were on the field compared to all of the team’s plays.
Targets and Attempts - Targets are how many times a player got the ball thrown to them (regardless of whether it resulted in a catch or not), and attempts are how many times a player was handed the ball for a run play.
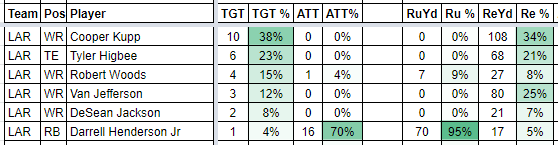
Target % and Attempt % - We can really start to understand a player’s usage when we look at their offensive target/attempt share numbers. In the example above, even though Van Jefferson and Cooper Kupp both had similar receiving yards, we feel a lot more comfortable with Kupp’s 38% target share moving forward. One thing that is important to note, is that I take Quarterback rushing attempts into account when calculating attempt share. I want to make sure that RBs on teams with Kyler Murray and Lamar Jackson at QB are properly being compared to RBs on teams with Matt Ryan and Kirk Cousins. Leaving our QB rushes would skew the numbers a bit.
Involvement (INVL) - This is a measure of how many times a player was involved (targets + attempts) relative to the number of snaps they played. The more snaps a player plays, the closer this number will be to their Usage Rate (explained next). However, for some of the lower tier RB2s, WR3s, and especially TEs, this is a really good number to focus on. If a player all of a sudden is scheduled to be in a starting role due to injury, we can take comfort in a high INVL rate from previous week’s when deciding whether they are a good play or not.
Usage Rate (USG) - This is a measure of how many times a player was involved (targets + attempts) relative to the team’s total number of snaps played. This will obviously skew higher for full-time starters who are on the field a lot. If a player is not producing, but is still consistently seeing a high snap % and a high usage rate, we can bet on this opportunity winning out in future weeks.
PRODUCTION
Rushing Yards, Receiving Yards, and Receptions - These are all very straightforward so I won’t spend too much time on these. I do include percentages for the yardages so you can compare relative to their team.
Catch % and Average Depth of Target (aDOT) - Catch Percentage is simply receptions divided by targets, but it is somewhat of a flawed stat and for that reason I do not have it formatted in pretty colors. The reason it is flawed is because aDOT (among other things) helps provide a lot of context. If a player is getting targetted with 20 yard passes, their catch rate is naturally going to be a lot lower than a player seeing a 5 yard aDOT and catching a lot of slants. Make sure to use these two stats hand in hand, to help understand a receivers production.
Air Yards - This is the first of a couple different advanced statistics for receivers. What Air Yards measures is the amount of total yards a receiver saw on every target. It doesn’t matter if a receiver caught the pass or not, but it helps illustrate the willingness of the QB and offense to get that player involved. Air Yards is somewhat of an opportunity stat because it doesn’t end up showing up on the fantasy stat sheet, but it fits in nicely with the next two metrics.
Receiver Air Conversion Ratio (RACR) - These next two metrics were both created by Josh Hermsmeyer, and RACR is simply the ratio of receiving yards to total air yards. Looking at RACR helps to answer the question of “At the depth of target a player is targeted most, how efficient are they?”
Weighted Opportunity Rating (WOPR) - Also created by Hermsmeyer, WOPR is a weighted combination of the share of team targets a player receives and the share of the team air yards. The official formula is: WOPR = 1.5 × Target Market Share + 0.7 × Air Yards Market Share. Elite wide receivers typically have a WOPR above 0.70.
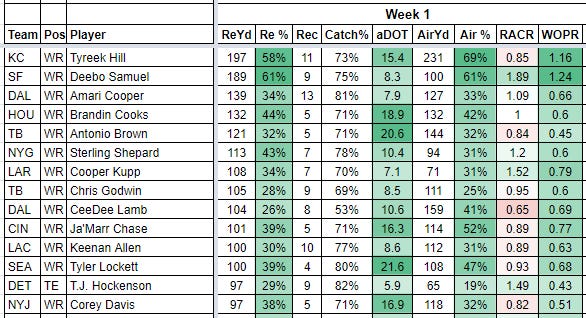
Using the chart above, I will talk through some ways to think about RACR and WOPR. If we take a look at T.J. Hockenson (RACR 1.49) vs. CeeDee Lamb (RACR 0.65) we can see that Hockenson had a much lower aDOT and was able to add some yards after catch to end up with a RACR above 1. Meanwhile Lamb only converted 65% of his Air Yards into real yards and was the least efficient player on the list. With no week’s of context yet, it’s hard to know if Lamb will continue to be inefficient this season, or if this was just an outlier game. Let’s look at two players who have a similar RACR but very different WOPRs, Antonio Brown (WOPR 0.45) and Ja’Marr Chase (WOPR 0.77). Although they were converting air yards at a very similar rate, Chase has much better underlying “Alpha” stats due to the larger WOPR. Brown may be an example of a player who “ran hot” this week. Over time, a high WOPR can help us figure out who the top WRs are on a team from a market share standpoint.
TD Rate & Dominator Rating (DOM) - TD rate is another straightforward one, as it just compares a players TDs to their teams total TDs that week. However it plays into the dominator rating, so I wanted to include these together. Dominator rating means what it sounds like, how much did a player dominate the game from a fantasy standpoint. For Running Backs, it accounts for Rush Yd share, Rec Yd share, and TD share. For receivers, air yards share is added in as well. Simply put, if a player is consistently producing a high DOM, they are someone we can trust to produce on a weekly basis.
RESULTS
I intentionally put the results portion of this database towards the far left. That’s because in my opinion it’s the least important. It shows the players PPR output for the week, and also their points relative to the rest of the non-QB fantasy points on there team. If we understand how the opportunity stats work, and we familiarize ourselves with some of the advanced analytics that make up the production section, the results side will come in due time.
A lot and I mean A LOT of fantasy football players only focus on the fantasy point output each week. Going back to what I said up top about variance and small sample size, if we focus on the things that contribute to fantasy results, we will make much better decisions each week rather then simply chasing box scores.
FORMAT
At the top of the sheet is a little bar showing the progress of the report. Once all the boxes are turned green, you can now know that the report is STATIC for the week and is ready to download and sort on your own.
I will typically leave the report with four different tabs each week. The first tab will be sorted by team, and the subsequent tabs will be sorted by each position (RB, WR, and TE). I won’t create the rest of these tabs until everything is completed for the week, to help minimize the re-work I have to do!
Enjoy everyone, and keep an eye out for the official Week 1 workload report later tonight!
Im new and was wondering how to do I use or get the google sheets link? Thank you